How to Set Up Distributed Tracing in Your Local Environment
It's deceptively simple to get distributed tracing setup on your local environment thanks to an all-in-one Jaeger Docker image.

I recently went through the process of setting up distributed tracing on my local machine to play around with things. I was expecting to spend a lot of time getting things going, but luckily, it was a lot more straightforward than I expected.
This post uses Jaeger as our tracing platform. To give a little background to those that aren't as familiar with it, Jaeger is a distributed tracing platform and the clients are implementations of the OpenTracing specification. You can learn more here: https://www.jaegertracing.io/
Getting Started
In order to stand up Jaeger locally, all you need is to have Docker installed and create a docker-compose.yml file with the following block:
version: '3.7'
services:
  jaeger:
    image: jaegertracing/all-in-one:latest
    ports:
      - "6831:6831/udp"
- "16686:16686"When that's ready to go, all you need to do is run the following command and you'll have Jaeger services running on your machine:
docker-compose upSimple Example
The following block of code initializes a Jaeger tracer and creates a single trace with a couple of spans. The config for Jaeger below uses a 100% sample rate and will output the spans as they are created which helps with debugging:
package main

import (
	"time"

	"github.com/opentracing/opentracing-go"
	"github.com/uber/jaeger-client-go"
	"github.com/uber/jaeger-client-go/config"
)

func main() {

	// Build tracer
	cfg := &config.Configuration{
		ServiceName: "service",
		Sampler:     &config.SamplerConfig{Type: "const", Param: 1},
		Reporter:    &config.ReporterConfig{LogSpans: true},
	}
	tracer, closer, err := cfg.NewTracer(config.Logger(jaeger.StdLogger))
	if err == nil {
		opentracing.InitGlobalTracer(tracer)
		defer closer.Close()
	}

	// Run task
	task(context.Background())
}

func task(ctx context.Context) {

	// Create span
	span, ctx := opentracing.StartSpanFromContext(ctx, "task")
	defer span.Finish()

	// Run task
	time.Sleep(1 * time.Second)

	// Run subtask
	subtask(ctx)
}

func subtask(ctx context.Context) {

	// Create span
	span, ctx := opentracing.StartSpanFromContext(ctx, "subtask")
	defer span.Finish()

	// Run subtask
	time.Sleep(500 * time.Millisecond)
}
Viewing Trace
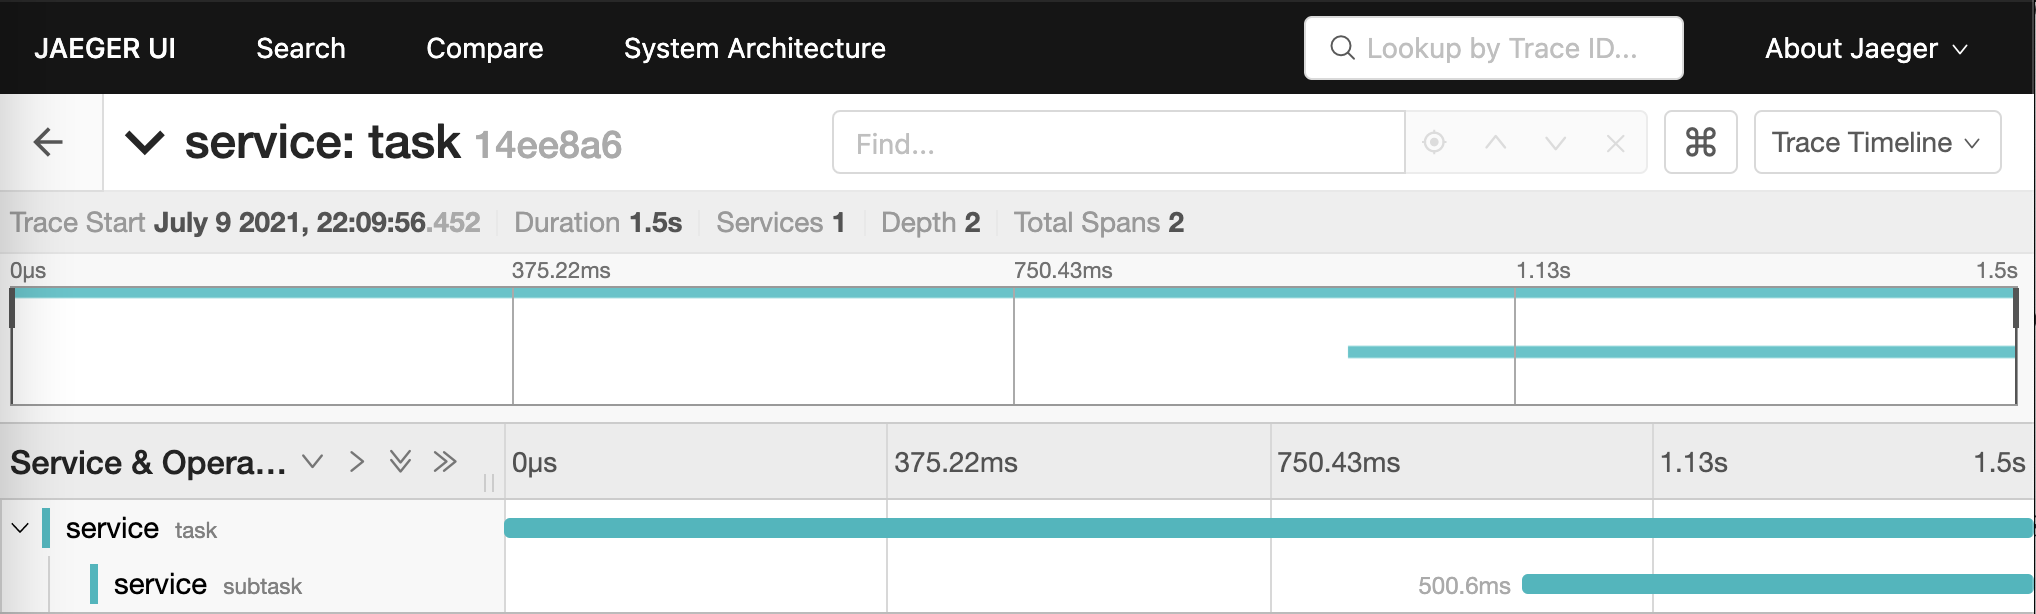
To view the trace and validate that it looks correct, the all-in-one Docker image contains a UI for this purpose. All you have to do is open up your browser and go here: http://localhost:16686/.
Once you have that opened up, just click the Find Traces button on the bottom of the left navigation and you should see a list of traces and choose the latest one which should look like the following:
I'll be adding some more posts that deep dive into more tracing concepts and examples. Hope things helps!